Historical Goal Scoring Trends and Their Role in Football Prediction Models
Written by Yara Peters · Oct 10, 2026
Historical Goal Scoring Trends and Their Role in Football Prediction Models
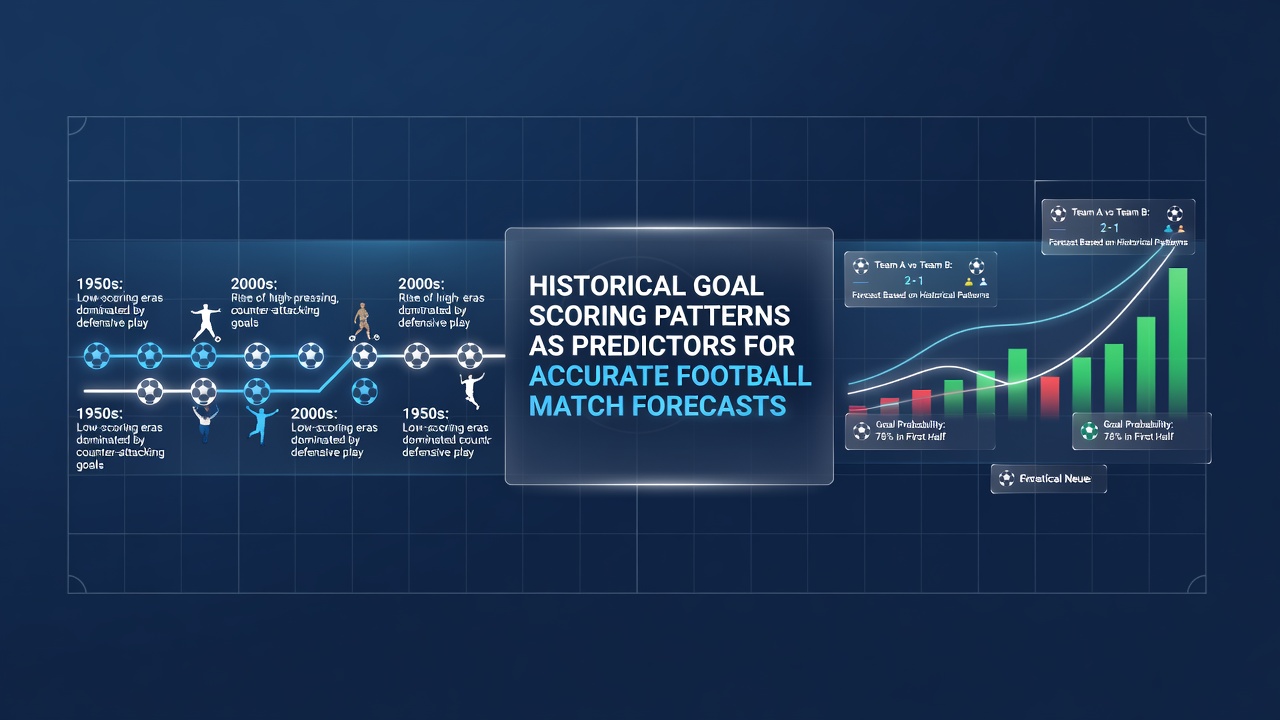
Football analysts have examined decades of match data to identify recurring goal scoring trends that appear across leagues and competitions, and these patterns frequently serve as inputs in statistical models designed to project match outcomes. Researchers compile records from domestic leagues and international tournaments to calculate averages for goals per game, timing of scores, and variations between home and away fixtures, then feed those figures into algorithms that generate probability estimates for future results. Data from the 2025-2026 season, collected through October 2026, continues to show consistent distributions that align with earlier decades, allowing forecasters to test whether long-term trends hold steady amid changes in playing styles or squad compositions.
Core Metrics Drawn from Past Matches
League-wide averages for total goals per match have remained relatively stable in top European competitions, hovering near 2.7 goals since the early 2000s according to aggregated figures released by UEFA technical reports, while individual team records reveal sharper differences based on venue and opponent strength. Analysts track metrics such as goals scored in the first versus second half, the frequency of late goals after the 80th minute, and the proportion of matches that end with exactly one, two, or three goals, because these breakdowns help models assign weighted probabilities to scorelines. Studies published in sports analytics journals demonstrate that teams with strong historical home scoring rates tend to maintain elevated output when playing at their own stadium, even as overall league averages fluctuate slightly from season to season.
Applying Patterns to Forecast Calculations
Prediction systems incorporate historical goal distributions by comparing a team's recent output against its long-term record against similar opposition, then adjust expected goal totals accordingly. For instance, data shows that matches between mid-table sides often produce fewer total goals than fixtures involving attacking teams with high historical conversion rates, and forecasters use Poisson distribution models calibrated on past seasons to estimate the likelihood of each possible scoreline. Observers note that patterns such as the higher incidence of goals in the final 15 minutes appear consistently across multiple leagues, prompting models to increase projected goal counts in the later stages of simulated matches. Those who maintain large datasets find that combining venue-specific scoring histories with head-to-head records produces tighter confidence intervals around predicted outcomes than models relying solely on current form.
League-Specific Variations and Data Sets
Different competitions exhibit distinct goal scoring profiles that forecasters must account for when building projections. The Bundesliga has recorded higher average goals per game than Serie A over the past 15 seasons, a difference that persists in both home and away fixtures, while the Premier League sits between these two in most years. Analysts at research institutions such as the Stats Perform research division maintain granular records that break down goal timing by 15-minute intervals, allowing models to adjust for periods when scoring rates typically rise or fall. Data collected through October 2026 indicates that these league differences have not narrowed substantially despite tactical shifts toward higher pressing and faster transitions, suggesting the patterns retain predictive value for the immediate future.
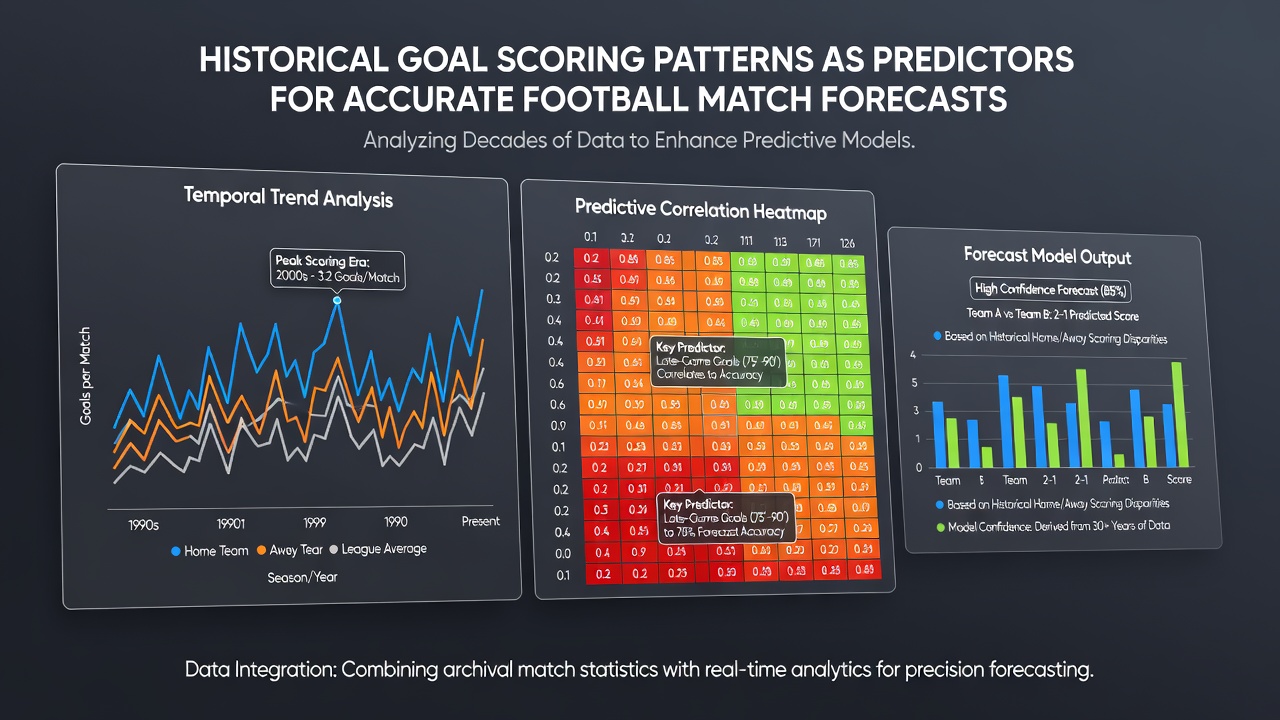
International tournaments add another layer because national teams play fewer matches and face varying levels of competition. Historical records from World Cup and European Championship qualifiers reveal that goal rates often differ between group stage and knockout fixtures, with lower scoring in elimination rounds. Forecasters therefore apply separate calibration factors when projecting outcomes in those settings, drawing on decades of tournament data rather than club league statistics alone. Teams that have consistently scored early in past tournaments continue to show elevated probabilities for opening-goal advantages, a trend that models capture through weighted historical inputs.
Limitations Observed in Pattern-Based Projections
While historical goal scoring data improves forecast calibration, several factors can reduce accuracy when applied without adjustment. Injuries to key attacking players, managerial changes, and shifts in league rules such as VAR implementation have altered scoring rates in specific seasons, requiring analysts to blend long-term averages with shorter recent windows. Researchers at academic centers have documented cases where teams with strong historical records suddenly produce outlier seasons, illustrating that patterns provide probabilistic guidance rather than deterministic certainty. Models that update historical baselines with current squad metrics tend to show lower error rates in back-testing across multiple European leagues compared with static historical approaches.
Conclusion
Historical goal scoring patterns supply a structured foundation for football match forecasts by quantifying recurring tendencies in total goals, timing, and venue effects across seasons and competitions. Data sets maintained by governing bodies and analytics firms allow models to assign probabilities that reflect observed distributions rather than assumptions, while ongoing collection through October 2026 helps verify whether established trends continue to hold. Analysts combine these records with contemporary variables to refine projections, recognizing that the value of historical patterns lies in their consistent statistical properties across large sample sizes.